Automate on-boarding Azure Log Analytics Container Monitoring of any Linux Docker Host using Azure Arc
That title is a bit of a mouthful, but this post will show how easy it is to configure a Linux Docker host to be monitored by Azure Monitor.
Azure Monitor can be used to monitor machines that are running in Azure, in any cloud or on-premises. For a machine to be monitored by Azure Monitor, it needs to have the Microsoft Monitoring Agent (MMA) installed. The machine either needs to be able to connect to Azure directly or via a Log Analytics Gateway.
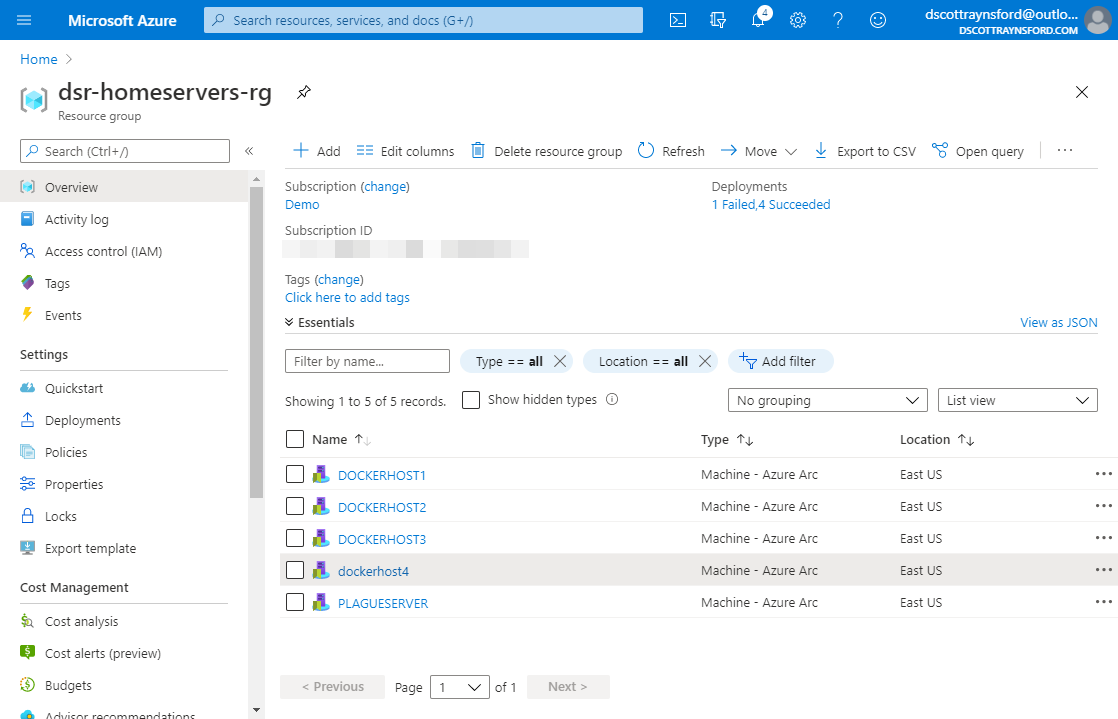
But to make things a lot easier, we’re going to set up the Docker host to allow it to be managed in Azure using Azure Arc. This will allow Azure Arc to install MMA for us. The Linux Docker host will appear in the Azure portal like other Azure resources:
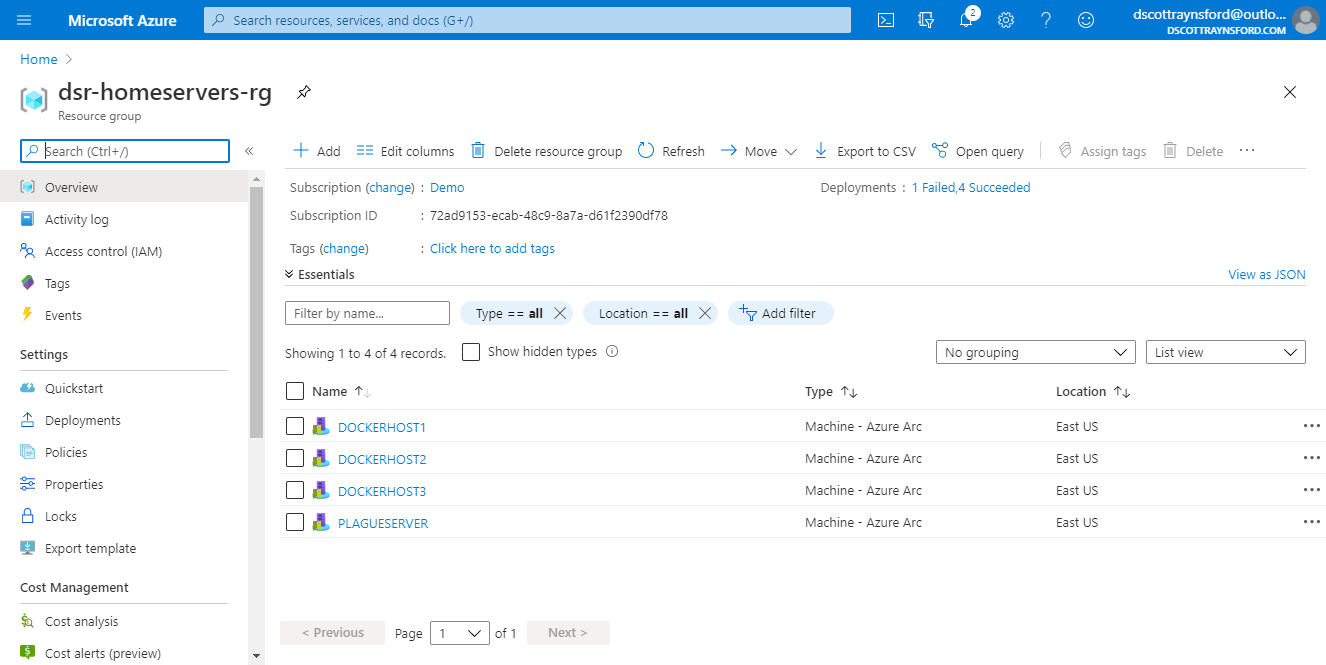
Azure Arc managed machines running outside of Azure
We will also add the Container Monitoring solution to our Azure Monitor Log Analytics workspace. The Container Monitoring solution will set up the Log Analytics workspace to record telemetry data from your Linux Docker host and add a container monitoring dashboard.
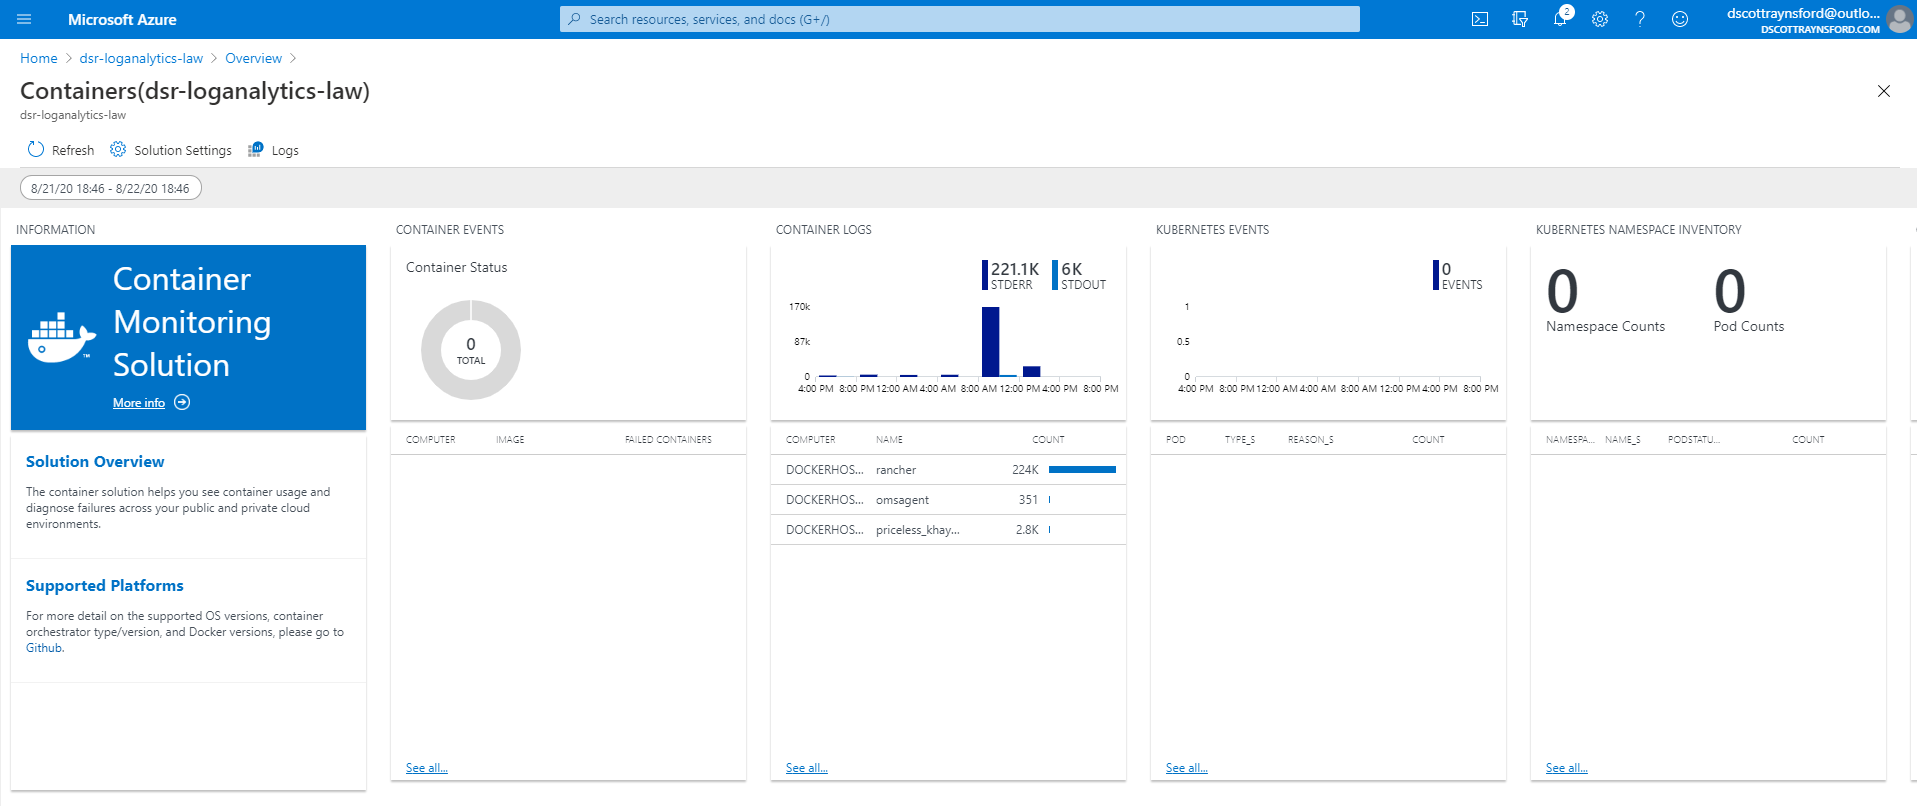
Container Monitoring Solution dashboard in an Azure Monitor Log Analytics Workspace
To enable collection and sending of telemetry from all containers running on the Docker host, a microsoft/oms container is run on it. This Docker container will connect to the Azure Monitor Log Analytics workspace and send logs and performance counters from all Docker containers running on the host.
Once we have completed the configuration of the Docker Host, the following telemetry will be sent to your Log Analytics workspace:
- Host diagnostics/logs.
- Host performance metrics.
- Diagnostics/logs from any Docker containers on the host.
- Performance metrics from any Docker containers on the host.
The cost of sending this telemetry to your Azure Monitor Log Analytics workspace will depend on the volume of data ingested. You can control this by reducing the frequency with which performance counters are transmitted. By default this is sent every 60 seconds. You can configure this through the Log Analytics workspace.
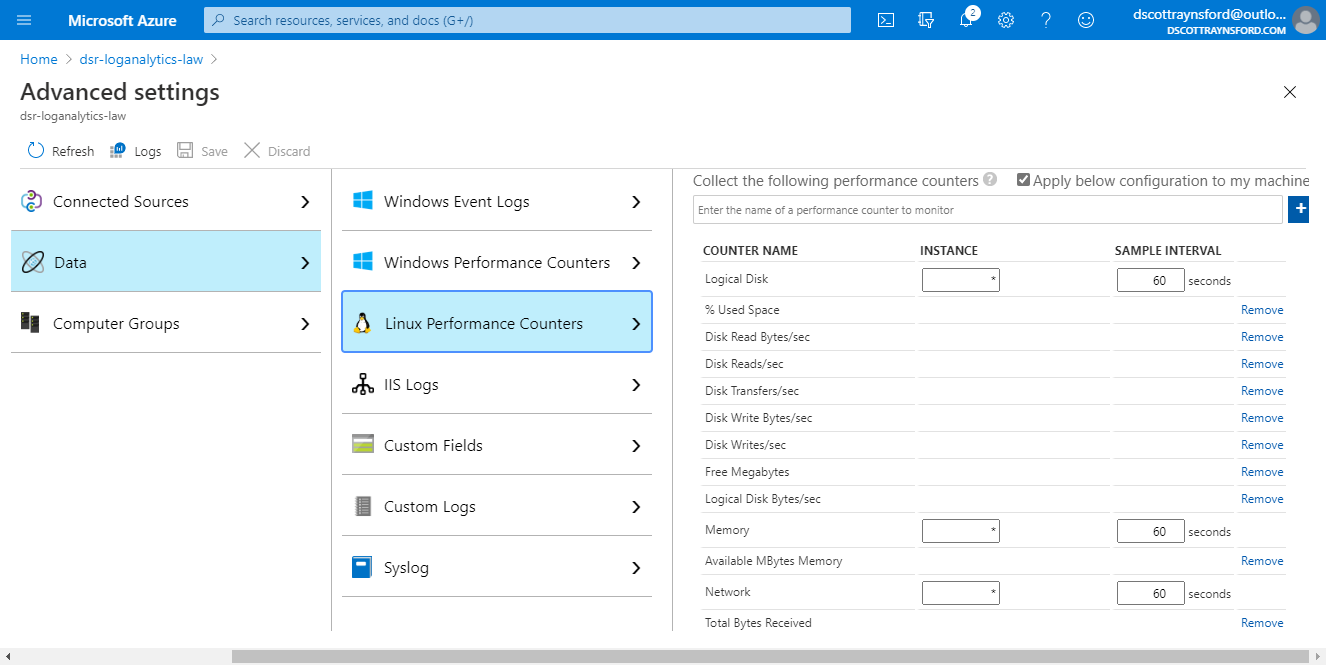
Configuring performance counter frequency
These instructions assumes you have the following:
- An Azure account - get a free account here.
- A Resource Group to contain the machines you register with Azure Arc - instructions on how to create one.
- A Log Analytics Workspace - instructions on how to create one. This is where all the diagnostic and metric data will be sent from the Docker hosts.
- Azure Cloud Shell enabled - how to use Azure Cloud Shell.
- SSH access to your Docker host to connect to Azure Arc.
- Important: the Linux host you are going to install MMA on must have Python installed. If it is not installed you will receive an “Install failed with exit code 52 Installation failed due to missing dependencies.” error when you install the MMA Agent.
The first step is to connect our Linux host to Azure Arc so that we can use it to perform all the other steps directly from the Azure Portal. We are going to use a service principal for onboarding the machine as this will make it easier to automate.
We are going to run this Azure Arc Onboarding script generator PowerShell script in Azure Cloud Shell to create the Service Principal and generate the Linux Shell script for us. It can also generate a PowerShell script for onboarding Windows machines to Azure Arc.
- Open Azure Cloud Shell and ensure you’re using PowerShell.
- Download the script by running:

- Run the script by executing the following command and setting the
TenantId,SubscriptionId,LocationandResourceGroupparameters: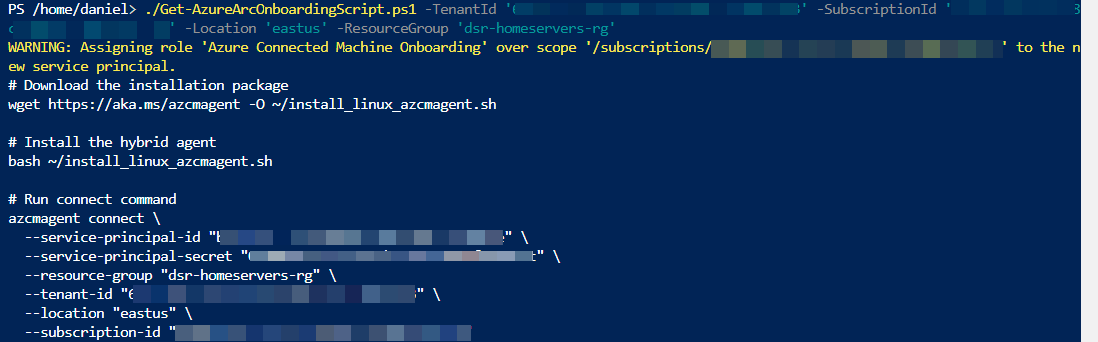 You will need to get your Tenant ID from the Azure Portal. The Subscription Id and Resource Group is the subscription and resource group respectively to register the machine in. The Location is the Azure region that the machine metadata will be stored.
 - Copy the script that was produced. We will execute it on any Linux machine we want to onboard.
- SSH into the Linux Host and run (paste) the script:
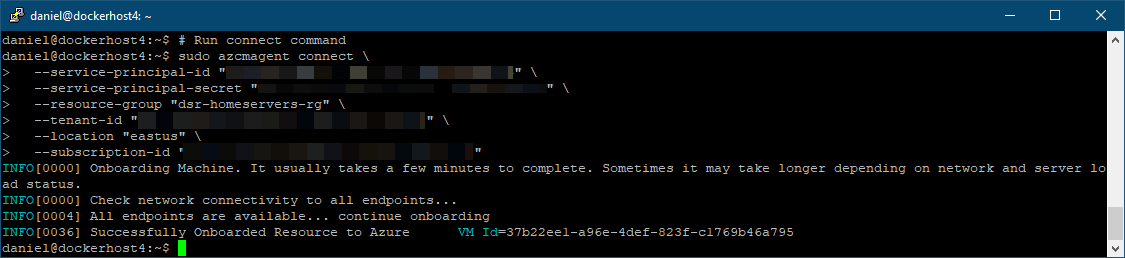 In a real production environment you’d probably automate this process and you’d also need to protect the secrets in the script.
 - Once the installation is complete, the machine will appear in the Azure Portal in the resource group:
Now that the machine is onboarded into Azure Arc, we can use it to install Microsoft Monitoring Agent (MMA) and then run the microsoft/oms Docker container.
Further Improvements: we could easily have used something like PowerShell DSC or Ansible to apply the Azure Arc onboarding configuration to the machine, but this is beyond the scope of this post. In a fully mature practice, there would be no need for logging directly into the host at any point in this process.
At the time of writing this blog post, there wasn’t an Azure PowerShell module or AzCLI extension for Azure Arc. So automating this process right now will require the use of an ARM template:
Important: Before you attempt this step, make sure the machine you are deploying MMA to has Python installed on it. If it is not installed you will receive an “Install failed with exit code 52 Installation failed due to missing dependencies.” error when you install the MMA Agent.
To apply the ARM Template in Azure Cloud Shell:
Run this command to download the ARM Template:
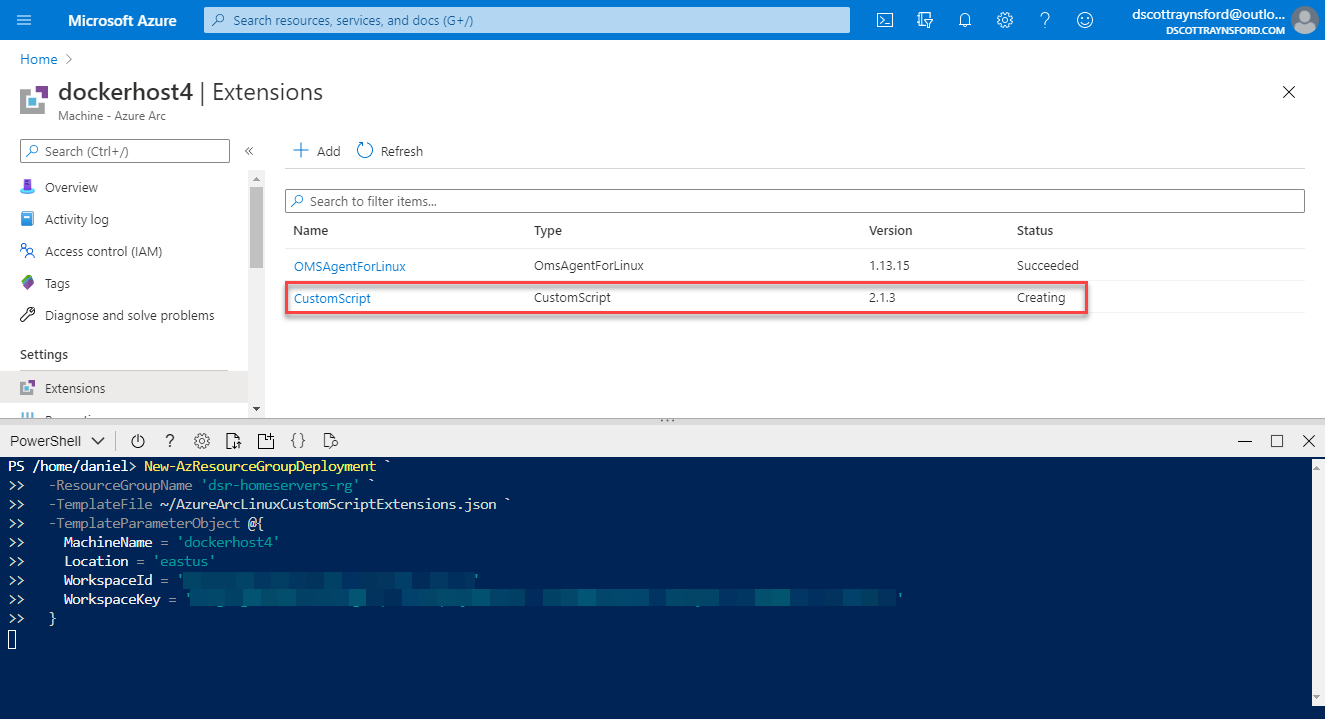
Apply the ARM Template to an Azure Arc machine by running this command (replacing the values in the strings):
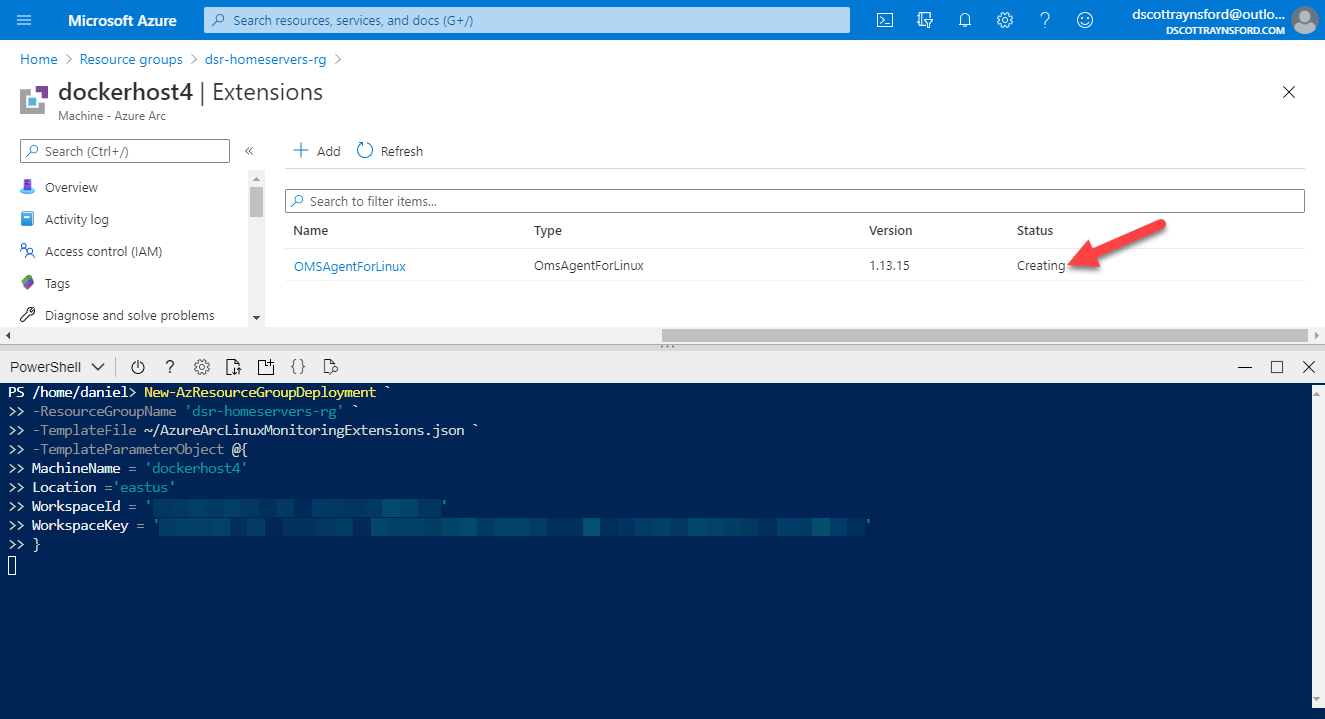 You can get the
 WorkspaceIdandWorkspaceKeyvalues by locating your Log Anayltics Workspace in the Azure Portal and clicking Agents Management in the side bar.Important: If you’re automating this, you’ll want to take care not to expose the Workspace Key.
You can navigate to the Azure Arc Machine resource in the Azure Portal and select the extension to see that it is “creating”. It will take a between 5 and 10 minutes before installation of the extension is completed.
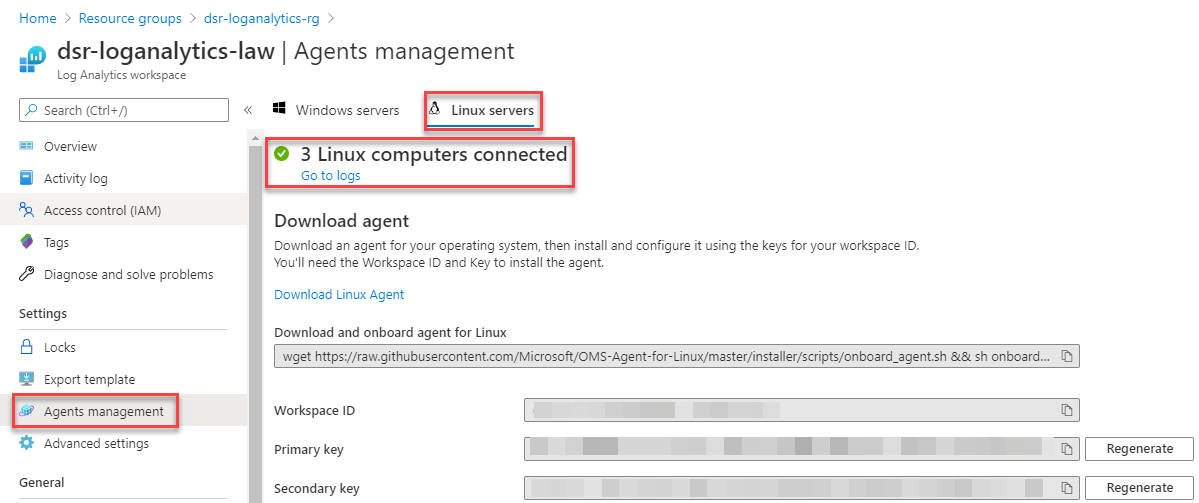
Once installation has completed, you can navigate to your Azure Monitor Log Analytics Workspace, click Agents Management in the side bar and select Linux Agents. You should notice that the number of agents has increased:
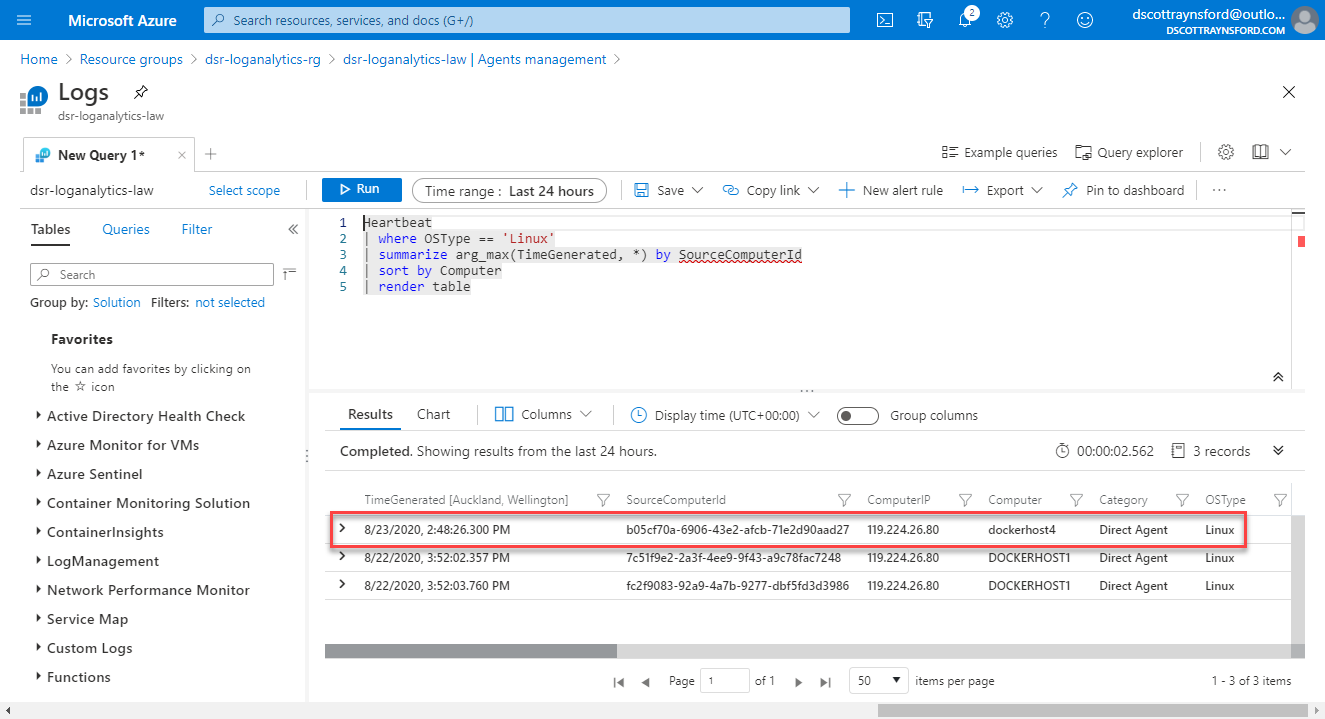
Clicking Go to logs will show all Linux Machines that Azure Monitor Log Analytics has received a Heartbeat from:
So far, so good. We’ve onboarded the machine to Azure Arc and enabled host logging to a Azure Monitor Log Analytics workspace. However, we’re only getting telemetry data from the host, not any of the containers. So the next thing we need to do is execute the following command on the host:
This will download and run the microsoft/oms container image on the host and configure it to send telemetry for all containers running on this host to your Azure Monitor Log Analytics workspace.
Important: If you are installing onto Ubuntu server, you can avoid problems in this stage by making sure you’ve installed Docker using the official Docker repository and instructions. I had used Snap on Ubuntu 18.05, which resulted in this error ‘Error response from daemon: error while creating mount source path ‘/var/lib/docker/containers’: mkdir /var/lib/docker: read-only file system.’ when running the script.
The way to automate the installation of this on the host is to again use an ARM Template, but this time use the Linux Custom Script extension to execute the above command. You can see the ARM Template here. This ARM template could easily be combined into the ARM template from the preceding stage, but I kept them separate for the purposes of showing the process.
- Run this command to download the ARM Template:
- Apply the ARM Template to an Azure Arc machine by running this command (replacing the values in the strings with the same ones as before):
- After a few minutes installation of the CustomScript extension should have completed and should show Succeeded in the Azure Portal.

- If you SSH into the Linux Container host and run
sudo docker psyou will see that the omsagent container is running:
The process is now complete and we’re getting telemetry from both the host and the containers running on it. We only needed to log into the host initially to onboard it into Azure Arc, but after that all other steps were performed by Azure. We could have performed the onboarding using automation as well and that would be the recommended pattern to use in a production environment.
The final (and optional) step is to configure sample interval that performance counters will be collected on each Linux host. To do this:
- Open the Azure Portal.
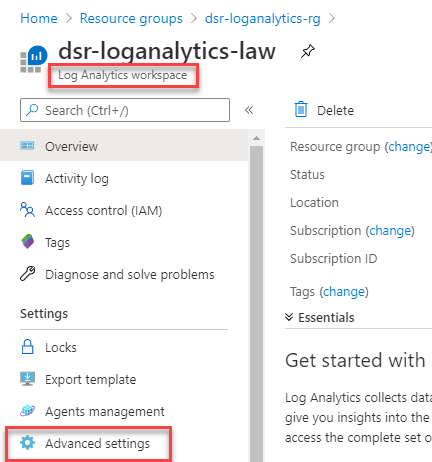
- Navigate to your Azure Monitor Log Analytics Workspace.
- Click Advanced Settings:
- Select Data, then Linux Performance Counters:
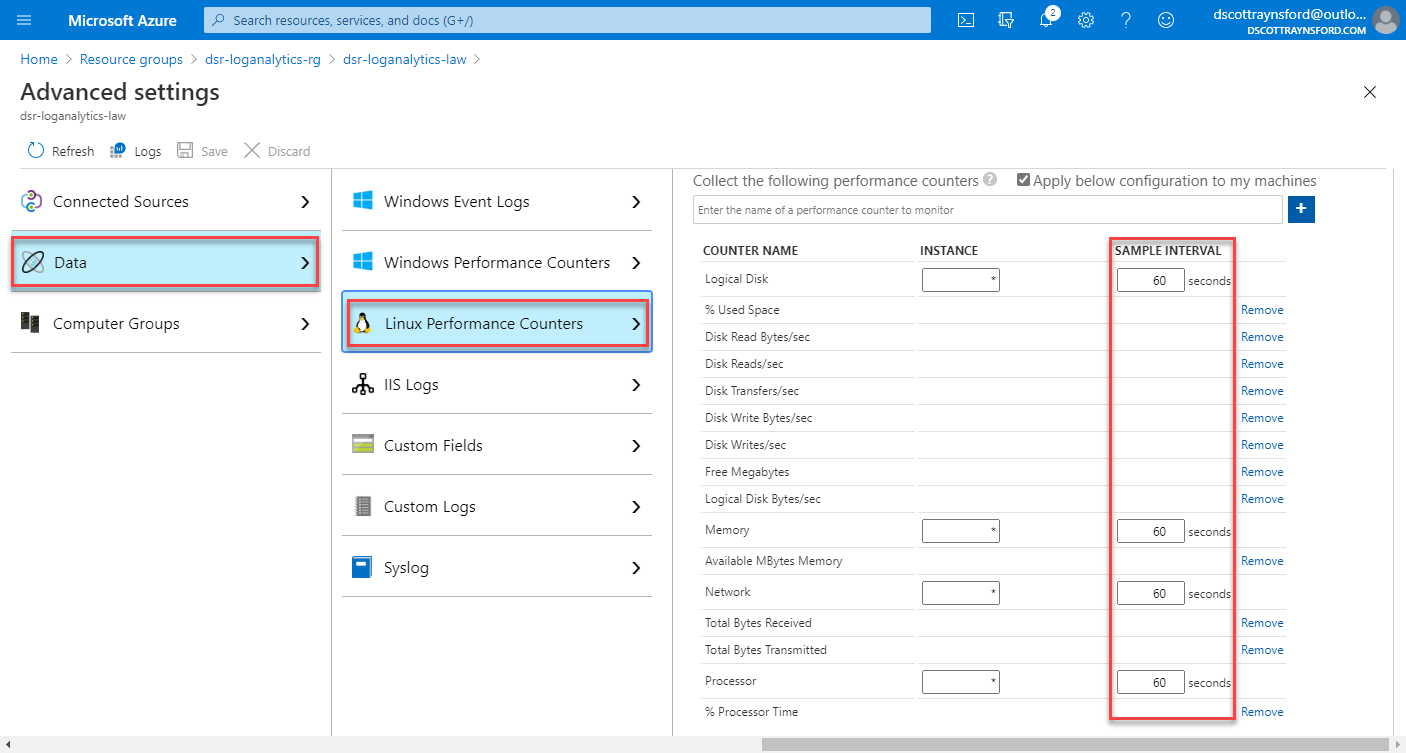
- Configure the Sample Interval and click Save.
The updated counter sample interval will be updated in the Microsoft Monitoring Agent configuration on the host.
Now that everything is all set up, let’s see what it looks like in Azure Monitor.
- Open the Azure Portal.
- Navigate to your Azure Monitor Log Analytics Workspace.
- Click Workspace Summary in the side bar.
- Click Container Monitoring Solution in the workspace overview:
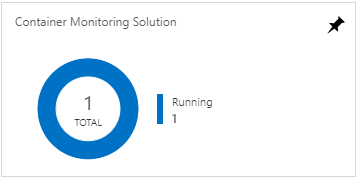
- You can now browse through the Container Monitoring Solution dashboard and see your hosts are being monitored as well as see performance information from your containers:
It really is fairly easy to get set up and once configured will give you much greater visibility over your entire estate, no matter where it is running.